The field of machine learning is thriving with a plethora of algorithms that can be used to solve a wide range of problems. One such algorithm is the k-Nearest Neighbor (k-NN), which is a simple yet powerful non-parametric method used for classification and regression tasks. In this article, we will delve into the world of k-NN and explore its implementation in R, a popular programming language for statistical computing and graphics.
Understanding the k-Nearest Neighbor Algorithm
The k-Nearest Neighbor algorithm is based on the principle of similarity. It assumes that objects or instances with similar attributes tend to belong to the same class or have similar target values. Given a new data point, the algorithm finds the k nearest neighbours from the training dataset and assigns a label or predicts a value based on the majority vote or averaging of the neighbours’ labels or values, respectively.
Implementing k-Nearest Neighbor in R
R provides several powerful packages for implementing machine learning algorithms, and k-NN is no exception. The “class” package in R offers the k-NN algorithm through the knn() function. Let’s dive into the code to see how it works:
# Load the required library
library(class)
# Load the dataset
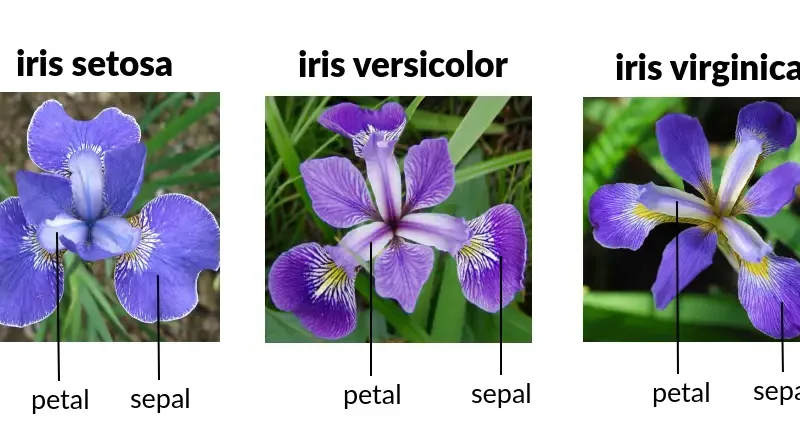
data(iris)
# Split the data into training and testing sets
set.seed(123)
train_indices <- sample(1:nrow(iris), 0.7 * nrow(iris))
train_data <- iris[train_indices, ]
test_data <- iris[-train_indices, ]
# Train the k-NN model
k <- 5
knn_model <- knn(train = train_data[, 1:4], test = test_data[, 1:4], cl = train_data$Species, k = k)
# Evaluate the model
accuracy <- sum(knn_model == test_data$Species) / length(test_data$Species)
cat("Accuracy:", accuracy)
In the above code, we load the “class” package, which provides the knn() function for k-NN classification. We use the famous Iris dataset as an example and split it into a training set and a testing set. Then, we train the k-NN model with k = 5 and predict the labels for the test set. Finally, we calculate the accuracy by comparing the predicted labels with the true labels.
Understanding the Role of “k” in k-Nearest Neighbor
In the k-Nearest Neighbor (k-NN) algorithm, the parameter “k” refers to the number of nearest neighbours that are considered when making a prediction for a new data point. When we set k = 5, it means that the algorithm will look at the five closest neighbours to the new data point in the training dataset.
To make a prediction, k-NN calculates the distance between the new data point and all the other data points in the training dataset. It then selects the k nearest neighbours based on the calculated distances. The algorithm considers the labels or values associated with these nearest neighbours and makes a prediction by taking the majority vote (for classification) or averaging (for regression) of their labels or values.
By choosing different values for k, we can influence the behaviour of the k-NN algorithm. For example, a smaller value of k, such as k = 1, would make the algorithm more sensitive to individual data points, potentially leading to more fluctuations in the predictions. On the other hand, a larger value of k, such as k = 10, would smooth out the predictions by considering a larger number of neighbours.
Selecting an appropriate value for k is crucial as it can impact the accuracy and generalization ability of the k-NN model. It often requires experimentation and testing with different values of k to find the optimal balance between overfitting and underfitting for a specific dataset.
In summary, when we set k = 5 in k-NN, it means that the algorithm considers the five nearest neighbours to a new data point to make predictions.
Conclusion
The k-Nearest Neighbor algorithm is a versatile and intuitive method for solving classification and regression problems. In this article, we explored the basics of the k-NN algorithm and implemented it in R using the “class” package. With its simplicity and effectiveness, k-NN remains a valuable tool in the data scientist’s toolbox. By experimenting with different values of k, one can find the optimal balance between bias and variance in their models. So, harness the power of k-NN in R and start building robust predictive models for your data!
Remember, the k-NN algorithm is just the tip of the iceberg when it comes to machine learning. Feel free to explore other algorithms and techniques to expand your knowledge and enhance your problem-solving capabilities. Happy learning and data exploration!
Read More